
The Escalation Blind Spot
Standard AI assistant metrics miss 31% of failures. A behavioral analysis of 1,250 conversations — and why the fix requires distinguishing two fundamentally different failure modes.
The Strategic Reveal
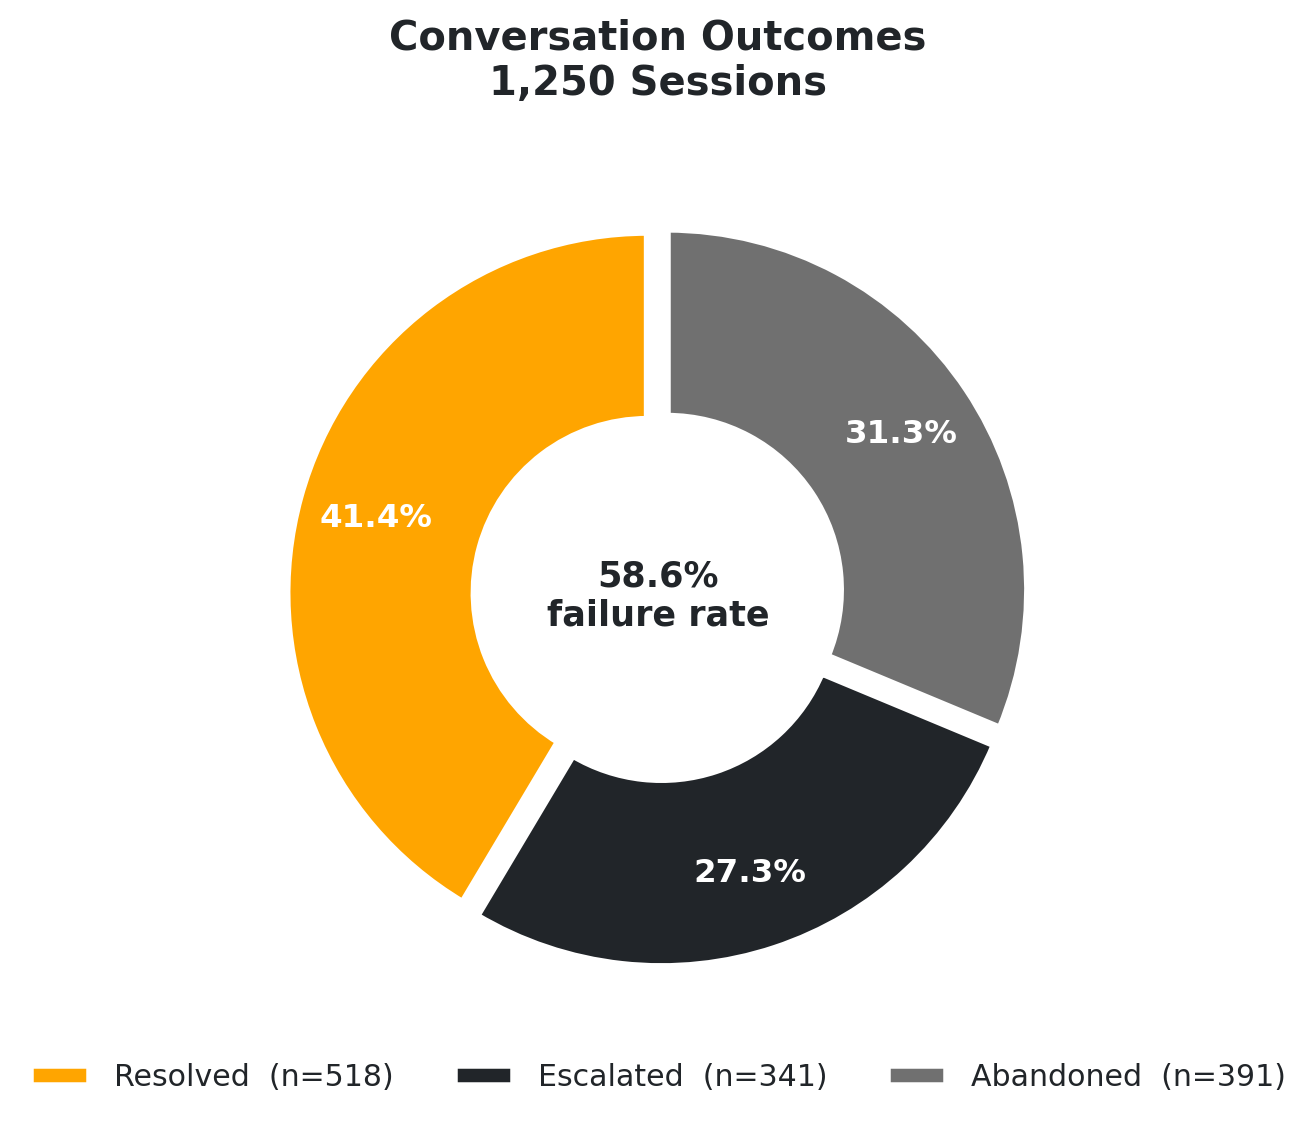
31.3% Hidden Failure
Abandonment (31.3%) is more common than escalation (27.3%). Teams measuring only escalation rate are blind to their most prevalent failure mode — users who leave silently before the bot can recover.
Behavioral Persistence
Escalated users average 3.0 failures before requesting a human — they persist. Abandoned users disengage earlier with fewer logged failures. Same outcome label, opposite behavioral profile.
Outcome Impact
Escalation-only tracking reports 27.3%. The real rate is 58.6% — abandonment is the invisible half.
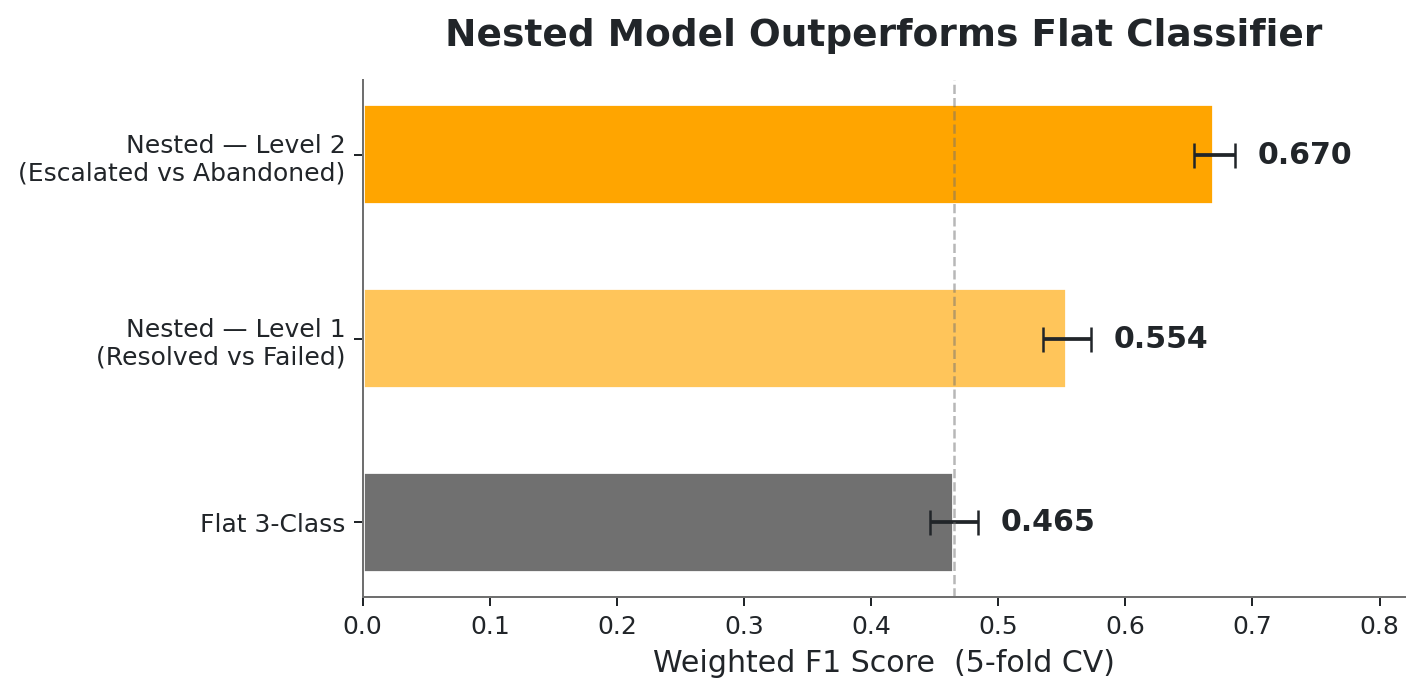
Nested classification outperforms flat 3-class modeling by recognizing that failure has structure, not just presence.
Escalation and abandonment have different behavioral signatures — and require different product interventions.
The Intervention Roadmap
Proactive Recovery
For silent abandoners, the lever is early outreach at Turn 2–3 before disengagement. A check-in message or simplified resolution path — triggered by early sentiment drop — can recover the session.
Resolution Accuracy
For persisters heading toward escalation, improve resolution logic for high-failure intents — particularly billing and technical support, which show the highest failure accumulation rates.
Measurement Integrity
Replace binary success tracking with a three-tier taxonomy: Resolved / Escalated / Abandoned. Without it, product teams are optimizing for an incomplete picture of user experience.
Reflection
The most important decision wasn't technical — it was asking whether "not escalated" meant success. It didn't. That question surfaced a 31% failure rate invisible to standard metrics. In AI product development, the outcome variable you choose determines what you can see, what you optimize, and what you ship. Measurement is a product decision.
Computational UXR Framework
Conversation failure isn't flat — it's nested. A behavioral researcher's approach to AI assistant evaluation, where psychology informs the model architecture.
Behavioral Taxonomy
Hierarchical Classification
The nested model mirrors the psychological arc of failure: first binary (did the session fail?), then categorical (how did it fail?). CV F1 = 0.670 at Level 2 confirms the two failure modes have meaningfully distinct behavioral signatures.
SQL Feature Engineering
Window functions extract psychological markers from raw turn logs: worst-moment sentiment (min_sentiment), emotional volatility (sentiment_range), and failure accumulation — collapsing 10,000 turn-level records into 1,250 session-level behavioral profiles.
Next Steps
The current pipeline establishes session-level behavioral prediction. Two planned extensions increase real-world utility.
Turn-Level Trajectory
SQL delta features capturing sentiment slope between Turn 1 and Turn 3. A sharp early drop is a stronger predictor of abandonment than session-average sentiment — enabling real-time intervention before failure crystallizes.
Algorithmic Equity
Intent-specific false negative rate analysis to ensure the model doesn't systematically miss failures in high-stakes categories. Billing and technical support users should not face higher misclassification rates.
Reproduce the Pipeline
Full SQL schema, nested classifier logic, and behavioral visualizations — documented in Python.
View on GitHub →